Predict Cumulative Incidence with Confidence Intervals
predict.TE_model.RdPredict Cumulative Incidence with Confidence Intervals
Arguments
- object
Object from
data_modelling()orinitiators().- newdata
Baseline trial data to predict cumulative incidence or survival for. If
newdatacontains rows withfollowup_time > 0these will be removed.- predict_times
Follow-up times to predict. Any times given in newdata will be ignored.
- conf_int
Calculate a confidence interval using coefficient samples from a multivariate normal distribution based on the robust covariance matrix.
- samples
The number of samples of the coefficients for prediction models.
- type
Type of values to calculate. Either cumulative incidence (
"cum_inc") or survival ("survival").- ...
Further arguments passed to or from other methods.
Value
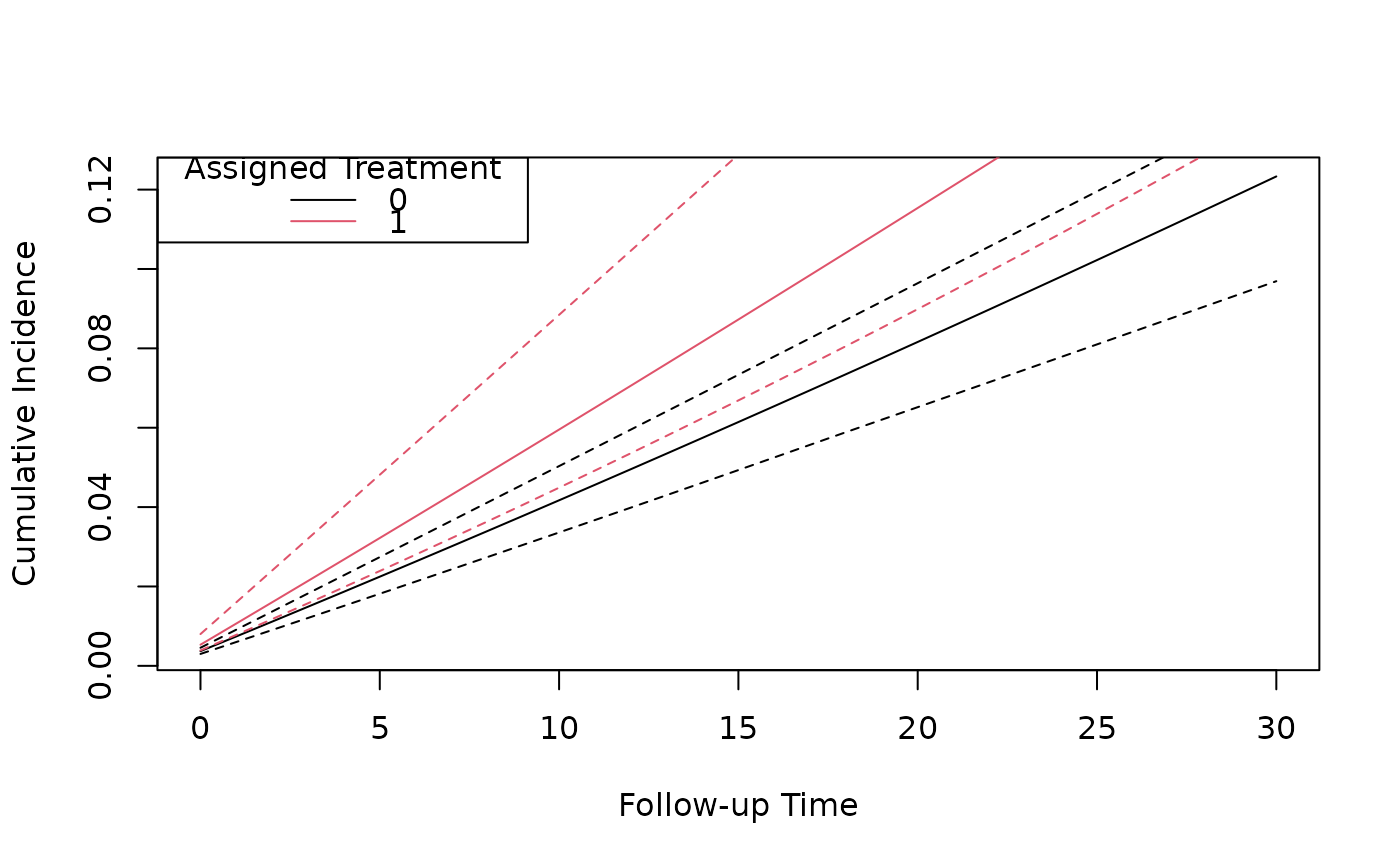
A list of three data frames containing the cumulative incidences for each of the assigned treatment options and the difference between them.
Examples
data("vignette_switch_data")
data_subset <- vignette_switch_data[vignette_switch_data$for_period > 200 &
  vignette_switch_data$for_period < 300, ]
model <- data_modelling(
  data = data_subset,
  outcome_cov = c("catvarA", "nvarA"),
  last_followup = 40,
  model_var = "assigned_treatment",
  include_followup_time = ~followup_time,
  include_expansion_time = ~for_period,
  use_sample_weights = FALSE,
  quiet = TRUE,
  glm_function = "glm"
)

predicted_ci <- predict(model, predict_times = 0:30, samples = 10)

# Plot the cumulative incidence curves for each treatment
plot(predicted_ci[[1]]$followup_time, predicted_ci[[1]]$cum_inc,
  type = "l",
  xlab = "Follow-up Time", ylab = "Cumulative Incidence"
)
lines(predicted_ci[[1]]$followup_time, predicted_ci[[1]]$`2.5%`, lty = 2)
lines(predicted_ci[[1]]$followup_time, predicted_ci[[1]]$`97.5%`, lty = 2)

lines(predicted_ci[[2]]$followup_time, predicted_ci[[2]]$cum_inc, type = "l", col = 2)
lines(predicted_ci[[2]]$followup_time, predicted_ci[[2]]$`2.5%`, lty = 2, col = 2)
lines(predicted_ci[[2]]$followup_time, predicted_ci[[2]]$`97.5%`, lty = 2, col = 2)
legend("topleft", title = "Assigned Treatment", legend = c("0", "1"), col = 1:2, lty = 1)


# Plot the difference in cumulative incidence over follow up
plot(predicted_ci[[3]]$followup_time, predicted_ci[[3]]$cum_inc_diff,
  type = "l",
  xlab = "Follow-up Time", ylab = "Difference in Cumulative Incidence",
  ylim = c(-0.1, 0.1)
)
lines(predicted_ci[[3]]$followup_time, predicted_ci[[3]]$`2.5%`, lty = 2)
lines(predicted_ci[[3]]$followup_time, predicted_ci[[3]]$`97.5%`, lty = 2)
